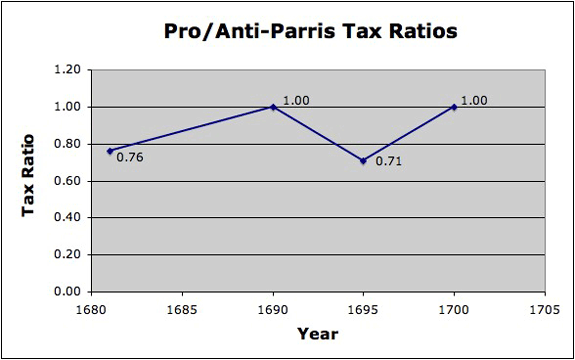
Faction Median Ratios:
1681-1700

The long-term relationship of the pro- and anti-Parris factions can be illustrated by creating a scatter plot of their median and mean tax ratios already calculated for the years 1681, 1690, 1695, and 1700. In a new worksheet, enter the tax years 1681, 1690, 1695, and 1700 in one column; in the adjoining column, enter the associated ratio of pro- to anti-Parris mean (or median) taxes for each year. Then select the two columns and choose the Chart Wizard's "XY (Scatter)" button.
The scatter plot of median taxes confirms that the pro-Parris setback in the period from 1690-1695 was only temporary. From the longer perspective of two decades, from 1681 to 1700, those associated with the witch hunt rose in their economic standing relative to witchcraft's opponents: by 1700, they had once again achieved parity. A scatter plot using the ratios of mean pro- and anti-Parris taxes demonstrates the same pattern of pro-Parris advance to equal economic status. The data do not support the idea that Salem Village's witch hunters were undergoing long-term economic distress compared to witchcraft's opponents. A clash between economic winners and losers does not appear to explain the sudden eruption of witch accusations in 1692. However, users should consider the limitations of the analysis — the limited number of petitioners on each tax assessment as well as the different members of each faction who appeared on different lists.
Users can also examine the ratios of the median and average pro-Parris and anti-Parris taxes compared to Salem Village as a whole during years from 1681 to 1700.
To investigate how individual members of the pro- and anti-Parris factions fared between 1690 and 1700, click Next.